

Melting ice in the Arctic Ocean.
Report The state of the world’s climate in 2022 World Meteorological Organization (WMO)released today highlights observed planetary-scale changes across land, oceans and atmosphere caused by record levels of Earth’s heat-trapping greenhouse gases.
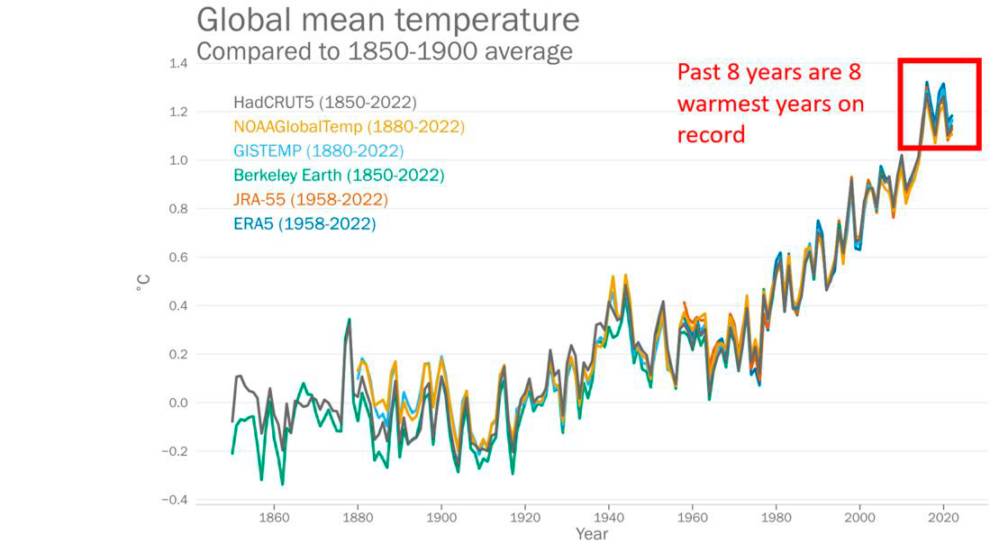
According to this institution, the period from 2015 to 2022 was the eight warmest years on record, despite the cooling effect caused by the La Niña episode over the past three years. The main concern is that an El Niño event will occur this year, which will have an additional effect on warming. Melting glaciers and warming waters are raising sea levels, which hit record levels again in 2022, an effect that will continue for thousands of years.
“Greenhouse gas emissions continue to rise and the climate continues to change, while populations around the world continue to be severely affected by extreme weather and climate events. In 2022, for example, a relentless drought in East Africa, record rains in Pakistan, and record heatwaves in China and Europe affected tens of millions of people, led to food insecurity, spurred mass migration and resulted in billions of dollars in losses. loss and loss,” said the Secretary-General of WMO, Petteri Taalas.
The WMO report follows the publication of The State of the Climate in Europe Report by the European Union’s Copernicus Climate Change Fund. It complements the Sixth Assessment Report of the Intergovernmental Panel on Climate Change (IPCC), which includes data up to 2020.
“We have the necessary tools, knowledge and solutions. But we must act quickly. We need to accelerate action on climate change through stronger and faster cuts in emissions to limit global temperature rise to 1.5°C. We must also radically increase investment in adaptation and resilience, especially for the most vulnerable countries and communities that contributed the least to the crisis,” said António Guterres on the occasion of Earth Day.
Observed Earth Changes
The report of the World Meteorological Organization focuses on key climate indicators, namely greenhouse gases, temperature, sea level rise, ocean heating and acidification, sea ice and glaciers. It also highlights the impacts of climate change and extreme weather events.
- average global temperature in 2022 stood at 1.15 [1,02 a 1,28] °C above the average for the period 1850-1900.
- Concentrations of the three major greenhouse gases — carbon dioxide, methane and nitrous oxide — reached their highest levels ever observed in 2021, the latest year for which consolidated global values are available (1984-2021). Real-time data from selected locations show that levels of three greenhouse gases continued to grow in 2022.
- Between October 2021 and October 2022, the average thickness of glaciers for which long-term data are available changed by an average of more than -1.3 meters. This is a much larger loss than the average over the past decade. Six of the ten years with the most negative mass balances on record (1950–2022) were recorded after 2015.
The cumulative power loss since 1970 is nearly 30m. In the European Alps, glacier melt has reached an all-time high due to a combination of light winter snow, a Saharan dust intrusion in March 2022, and heatwaves that occurred from May to early September. - Antarctic sea ice fell to 1.92 million km2 on February 25, 2022, lowest level ever and almost 1 million km2 below the long-term average (1991-2020).
- Ocean heat content reached a new record high in 2022. About 90% of the energy captured in the climate system by greenhouse gases ends up in the oceans, somewhat mitigating temperature increases but posing risks to marine ecosystems. The rate of ocean warming has been particularly high in the last two decades. Despite the persistence of characteristic La Niña conditions, 58% of the ocean surface experienced at least one marine heat wave in 2022. Data for 2023 already exceeds this.
- Global mean sea level continued to rise in 2022, reaching a new record high since satellite altimeter data were available (1993-2022). The rate of global mean sea level rise doubled between the first decade of satellite observations (1993–2002, 2.27 mm/yr) and the last (2013–2022, 4.62 mm/yr).
- Ocean acidification: CO₂ reacts with seawater resulting in a drop in pH, referred to as “ocean acidification”, which poses a threat to organisms and ecosystem services. The IPCC Sixth Assessment Report concluded that, with very high confidence, open ocean surface pH is now at its lowest level in at least 26,000 years and that the current rate of pH change is unprecedented at least since that time.
Source: El Independiente